• Skip to secondary menu
  • Skip to main content
  • Skip to primary sidebar
  • Skip to footer

Toronto Real Estate - Max Seal Blog

Toronto Real Estate, Central Toronto Real Estate, Toronto Condos For Sale, Search toronto condos for sale, Max Seal, Broker, iPro Realty Ltd.

  • Toronto Real Estate – Max Seal Blog
  • Home
  • Toronto Condo Evaluation
  • Toronto Real Estate Blog
  • Contact Max
  • Toronto Real Estate News
  • Search Toronto MLS
  • FSBO Expired Seller Free CMA
  • Seller
  • Buyer
  • Privacy Policy

Vancouver homeowners become Canada’s first ‘city of millionaires,’ study notes

September 10, 2016 by Toronto Real Estate Blog Leave a Comment

image-22-vancouver-homeowners-become-canadas-first-city-of-millionaires-study-notes-screenshot


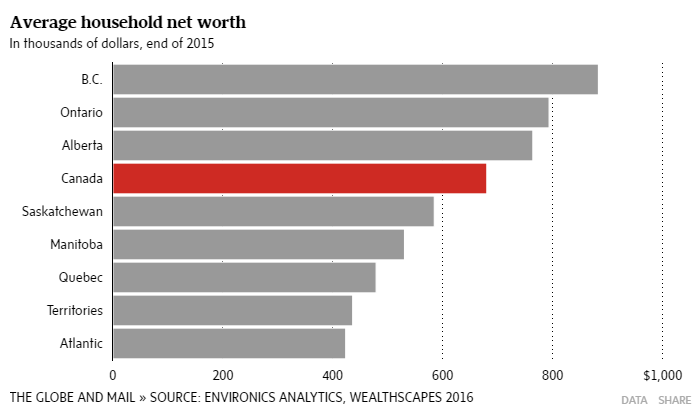
 In toronto real estate, a strong housing market is making Canadians wealthier, on paper, as the value of their homes outstrips a rising amount of debt.

In toronto personal finance, household debt across the country grew by 4.1 per cent last year to an average of $133,170 while average household net worth increased slightly more, rising by 4.3 per cent to $680,098, according to the latest WealthScapes analysis by Environics Analytics. That leaves many households in decent financial shape despite challenging market conditions.

Households in British Columbia are the richest, according to the study, with net worth growing by 6.3 per cent to $883,049. Growth in B.C. was fuelled by a scorching hot real estate market centred on Greater Vancouver. In fact, Vancouver became Canada’s first “city of millionaires” with the average household net worth hitting $1,036,202, a 7.1-per-cent increase from 2014.

Real estate holdings – which include appreciation on existing homes as well as new investments – increased by 11.9 per cent in Vancouver, well above the national average growth rate of 4.6 per cent.

Home prices have run up so far in B.C.’s Lower Mainland that the provincial government recently imposed a 15-per-cent tax on foreign buyers of homes in some municipalities, in a bid to cool the market and resist a tide of capital from China and elsewhere.

While many Canadians became wealthier, those in oil-dependent provinces struggled and saw household net worth rise by weak levels – 1.1 per cent in Saskatchewan and 1.8 per cent in Newfoundland and Labrador – or even fall. In the case of Alberta, household net worth declined by 0.7 per cent.

After British Columbia, Ontario boasts the richest households, with net worth growing by 5.2 per cent to $793,338. Alberta, which was the second-richest province last year, saw household net worth decline to $763,812, dropping to third in the national rankings.

image-22-average-household-networth-screenshot

The average worth of liquid assets per household decreased in Vancouver, which Mr. Miron said suggests that some are cashing in their savings to make a down payment on real estate.

“The big worry on our radar at the moment is Vancouver,” Mr. Miron said. “It’s basically only real estate that’s fuelling growth in Vancouver.”

Conversely, the increase in Ontario’s net worth was spread among liquid assets, pensions and above-average real estate growth. While Toronto saw real estate growth contribute significantly to household net worth increases, households also experienced substantial gains with other assets.

Mr. Miron said there are no major indicators of volatility, but many questions regarding oil prices, the impact of B.C’s foreign buyer tax, and the possibility that the United States will raise interest rates.
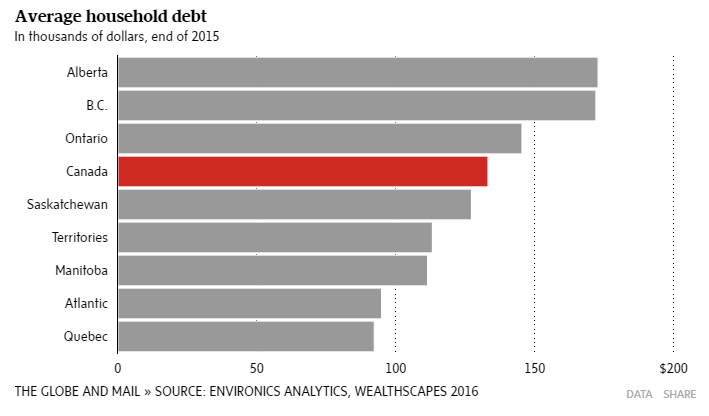
Debt

Debt levels in 2015 grew at a slightly higher rate – 4.1 per cent – than in previous years, outpacing household income growth, which increased by 3.2 per cent.

However, the rising level of debt can be attributed to rising levels of mortgage debt, which increased by 5.1 per cent to $94,867. With historically low interest rates, Mr. Miron says it’s never been more affordable for Canadians to borrow.

“The big risk there is what happens if interest rates do start increasing,” he said. “Right across the board, Canadians would feel it. However, it would be concentrated in the areas which are more debt heavy, like for example Vancouver, Toronto and Calgary.”
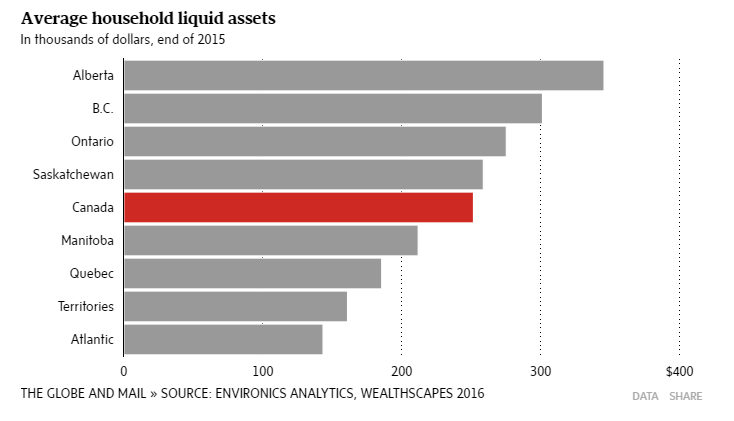
image-22-average-household-debt-screenshot


Liquid assets

Despite a rocky year on the stock market, Canadian households on average managed to save more, with liquid assets increasing by 3 per cent to $251,559 in 2015. Investments – including bonds and segregated and mutual funds – made up a majority of those assets.

“This time around, we’re seeing Canadians being very cautious, particularly in areas related to taking on more debt,” Mr. Miron said. “At this point they are not very optimistic, which means they are being prudent, which can be considered both positive and negative.”

image-22-average-household-liquid-asset-screenshot


Pensions

Employer pension plans were the fastest-growing asset for Canadians on average in 2015.

Pension assets – predominantly within defined-benefit plans, where payouts are determined based on salary and years of service – increased 5.7 per cent nationally to $140,204. Pension assets grew the most in Manitoba – by 8.3 per cent to $142,740 – and in the Atlantic provinces, up 8.3 per cent to $138,804.

Mr. Miron said the increase appears to be tied less to new investments than to the appreciation in pension plan assets.

“With long-term interest rates continuing to decrease and Canadian longevity continually improving, it’s really forcing the defined-benefit pension plan values up,” Mr. Miron said.

image-22-average-household-pension-assets-screenshot
Read the full post in Globe And Mail

Filed Under: Toronto Personal Finance Posts, Toronto Real Estate Posts Tagged With: household debt, household liquid asset, household networth, household pension, toronto personal finance, toronto real estate

Reader Interactions

Leave a Reply Cancel reply

Your email address will not be published. Required fields are marked *

Primary Sidebar

Toronto Real Estate – Max Seal Blog

Max Seal, Broker,
Call 647-294-1177
Email: email to Max

iPro Realty Ltd., Brokerage
1396 Don Mills Rd, #101, Bldg E, Toronto, Ontario, M3B 3N1

Totonto Market Evaluation Online

TORONTO HOME EVALUATION ONLINE

Call, text, email Max 647-294-1177

Call, text or email Max Seal at 647-294-1177 if you are thinking to sell your upscale or average home in Central Toronto communities like Bedford Park, York Mills, Lawrence Park, Forest Hill, Davisville, Summerhill, Yorkville, Annex, Rosedale,  Leaside and Don Mills.  Please click the link for a FREE Home Evaluation. No obligation.

Font Resize

Search Blog Posts

Recent Posts

  • Toronto Real Estate TRREB Published September, 2022 Resale Market Figures
  • BoC Hikes Interest Rate by 1 per cent in July, 2022, Acts Like a Hammer to Housing
  • Toronto Real Estate TRREB Published August, 2022 Resale Market Figures
  • Toronto Real Estate TRREB Published July, 2022 Resale Market Figures
  • Toronto Real Estate TRREB Published June, 2022 Resale Market Figures

Recent Comments

    Pages

    • Buyer
    • Contact Max
    • FSBO Expired Seller Free CMA
    • Home
    • Privacy Policy
    • Search Toronto MLS
    • Seller
    • Toronto Condo Evaluation
    • Toronto Real Estate – Max Seal Blog
    • Toronto Real Estate Blog
    • Toronto Real Estate News
    Totonto Market Evaluation Online

    TORONTO HOME EVALUATION ONLINE

    Categories

    Archives

    Toronto Real Estate Blog – Max Seal

    Max Seal, Broker,
    Call 647-294-1177
    Email: email to Max

    iPro Realty Ltd., Brokerage
    1396 Don Mills Rd, #101, Bldg E, Toronto, Ontario, M3B 3N1

    Footer

    Copyright @2020 TorontoRealEstateMax.com Toronto Real Estate – Max Seal Blog

    Copyright © 2022 – All rights reserved

    Toronto Real Estate Blog – Max Seal

    Max Seal, Broker,
    Call 647-294-1177
    Email: email to Max

    iPro Realty Ltd., Brokerage
    1396 Don Mills Rd, #101, Bldg E, Toronto, Ontario, M3B 3N1

    Totonto Market Evaluation Online

    TORONTO HOME EVALUATION ONLINE

    Copyright © 2025 · Lifestyle Pro on Genesis Framework · WordPress · Log in